Under Analyses you'll find all pages you've checked with your account, with scores, recommendations and measured values. This article explains how to read the results and what to do with them.
Where do I find my analyses?
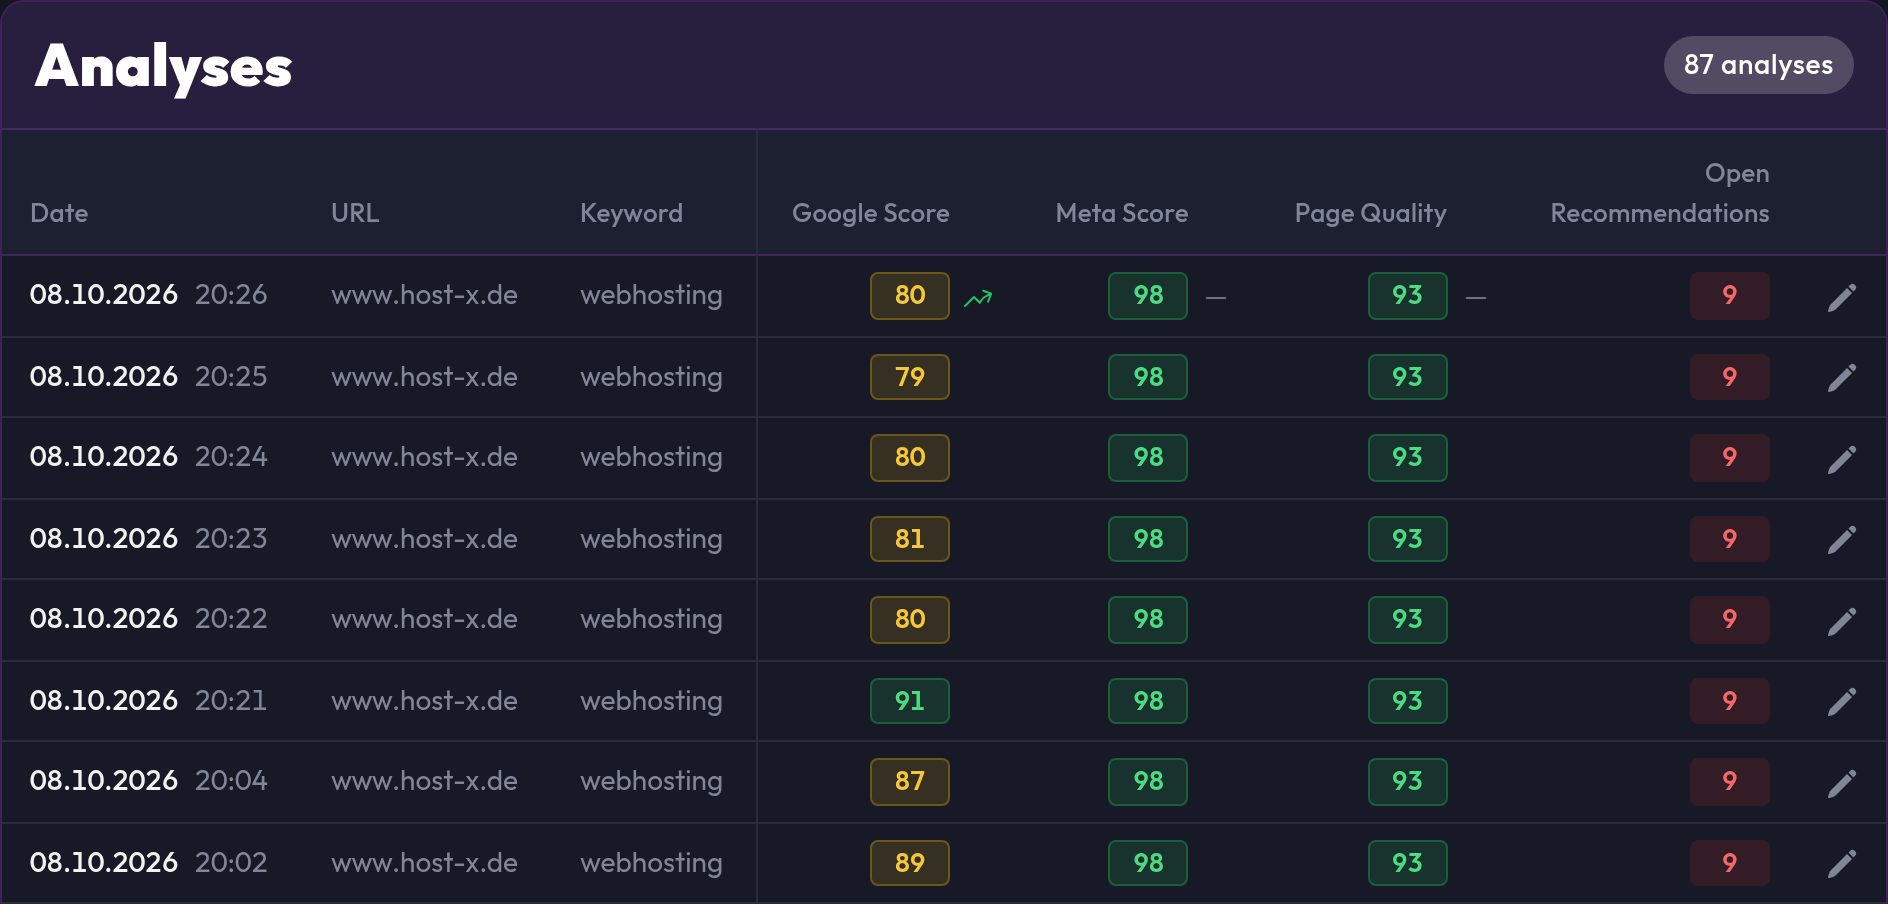
Open Analyses in the navigation. The list shows every saved analysis with:
| Column | Meaning |
|---|---|
| Date | When the analysis was run |
| URL | The checked page |
| Keyword | The keyword it was checked for |
| Google Score | PageSpeed value from Google |
| Meta Score | Rating of title, description and meta tags |
| Page Quality | Content and technical quality |
EXPORT downloads the list. A click on a row opens the analysis details.
You start new analyses in the Page Audit, not in this list. If an analysis says Running, it isn't finished yet, and with Incomplete values are missing. Missing values never count as passed, so just run the analysis again.
What is analyzed?
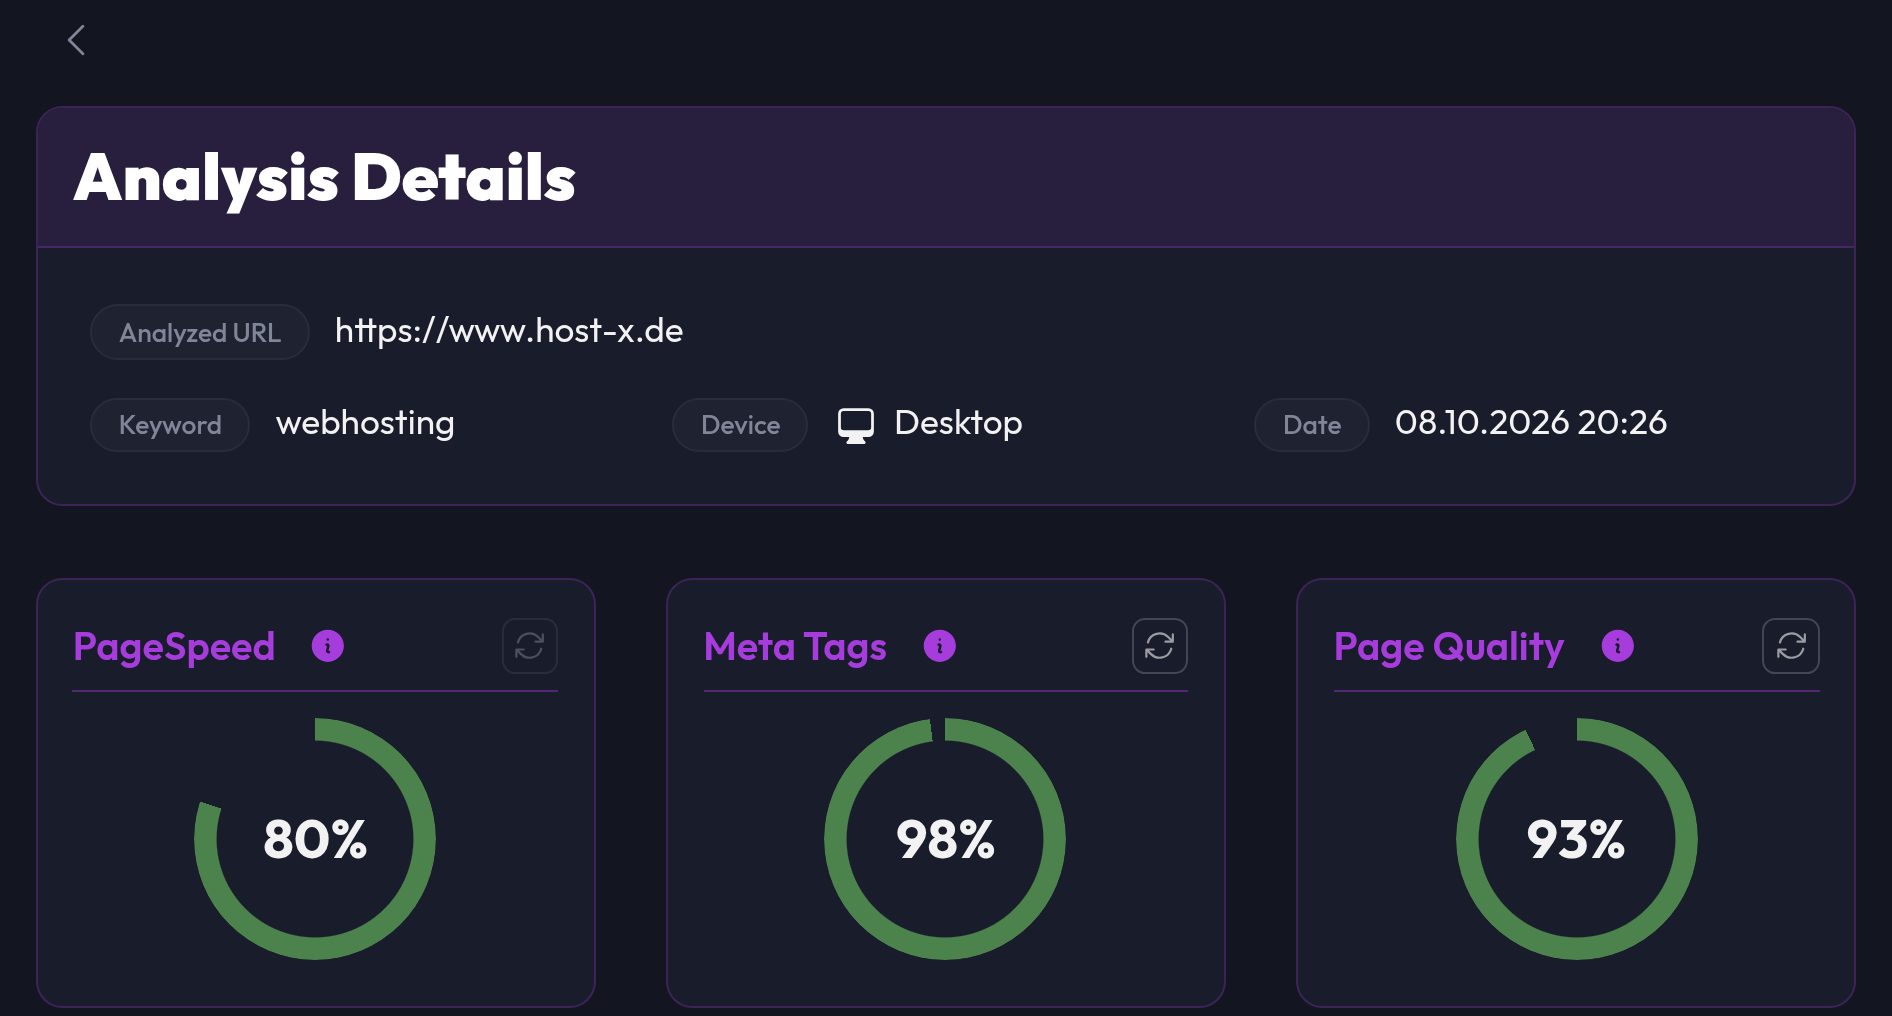
Every analysis gives the page three scores (PageSpeed, Meta, page quality) and the details behind them.
On-page SEO
- Meta tags: title, description, robots and more
- Heading structure: H1 to H6, present and sensibly structured
- Keywords & content: text length and distribution of the keyword
- Image analysis: alt texts, file size, format
- Link analysis: internal and external links
- Canonical and hreflang tags: duplicate content and language versions
- Schema.org / JSON-LD and Open Graph tags: structured data and social preview
- Favicon and HTML5 structure
- Competition Top 3: who leads for your keyword
Technical SEO and performance
- HTTP headers: status, redirects, caching, SSL
- PageSpeed details and Core Web Vitals
- JavaScript, resource and network optimization
- CSS & JavaScript, preload & prefetch
Backlinks and domain authority aren't part of this analysis, you get those separately in the backlink analysis.
Interpreting the results
The scores
Each score lies between 0 and 100:
- 90 and above: Good. The page is solid in this area
- 70 to 89: Medium. Small improvements are possible
- below 70: Weak. Work here first
There is no overall grade, on purpose. Look at each score on its own, otherwise a weak value disappears behind good ones.
Passed and failed
The detail cards show for each criterion Passed, Failed or No data. "No data" is not a passed check, the value simply couldn't be captured. Re-analyze fetches the data again.
Recommendations
At the top of the details is the SEO Action Plan with the groups Critical Issues, Improvements and Passed. How to work with it is explained in the Page Audit.
Performance metrics
Core Web Vitals
Google judges websites by these three metrics, among others:
LCP (Largest Contentful Paint)
- Measures the loading time of the largest visible element
- Target: < 2.5 seconds
- Good: under 2.5 s, needs improvement: 2.5 to 4 s, poor: over 4 s
INP (Interaction to Next Paint)
- Measures how quickly the page responds to interactions (click, tap, keyboard); replaces FID as a Core Web Vital
- Target: < 200 milliseconds
- Good: under 200 ms, needs improvement: 200 to 500 ms, poor: over 500 ms
CLS (Cumulative Layout Shift)
- Measures visual stability while loading
- Target: < 0.1
- Good: under 0.1, needs improvement: 0.1 to 0.25, poor: over 0.25
Typical optimizations
Critical issues
These shouldn't sit around for long:
- Missing title tag: every page needs a unique title
- No meta description: write a description (150-160 characters) for every important page
- No SSL certificate: enable HTTPS for your whole website
- Broken links: repair or remove links that do not work
- Missing viewport tag: without it the page is not usable on mobile
Improvements
You can take care of these afterwards, at your own pace:
- Title too long/short: optimal is 50-60 characters
- Description too long/short: optimal is 150-160 characters
- Missing alt texts: add descriptive alt texts to all images
- Slow loading time: optimize images and enable caching
- Thin content: expand pages to at least 300 words
- Structured data: implement Schema.org markup
- Open Graph tags: optimize the social media preview
- Internal linking: link relevant content with each other
Mobile and desktop
The details of an analysis show under Device what it was made for. The PageSpeed score from Google refers to the mobile view. Only compare analyses of the same device.
Google mainly indexes the mobile version of your website, so on mobile it's worth taking a close look at:
- Touch-friendly buttons: at least 48×48 pixels
- Readable font size: at least 16px without zooming
- Viewport meta tag:
<meta name="viewport" content="width=device-width, initial-scale=1">
Regular monitoring
Analyze important pages regularly and compare the results. Thats how you spot trends and can react in time. You see the history of your scores in the dashboard: development over time, change versus the previous analysis and the number of open recommendations.