Under SERPS you can see how your pages do on Google: which keywords they appear for, at which position and how many clicks that turns into.
What is SERP tracking?
SERP stands for "Search Engine Results Page". SEOFuxx doesn't measure the positions itself, it takes the numbers from your Google Search Console. Thats real data from Google: how often your page showed up in the results (impressions), how often someone clicked (clicks) and which position it held on average.
Prerequisites
- Search Console is connected (see Setting Up Google Search Console)
- Your account has a project with your domain
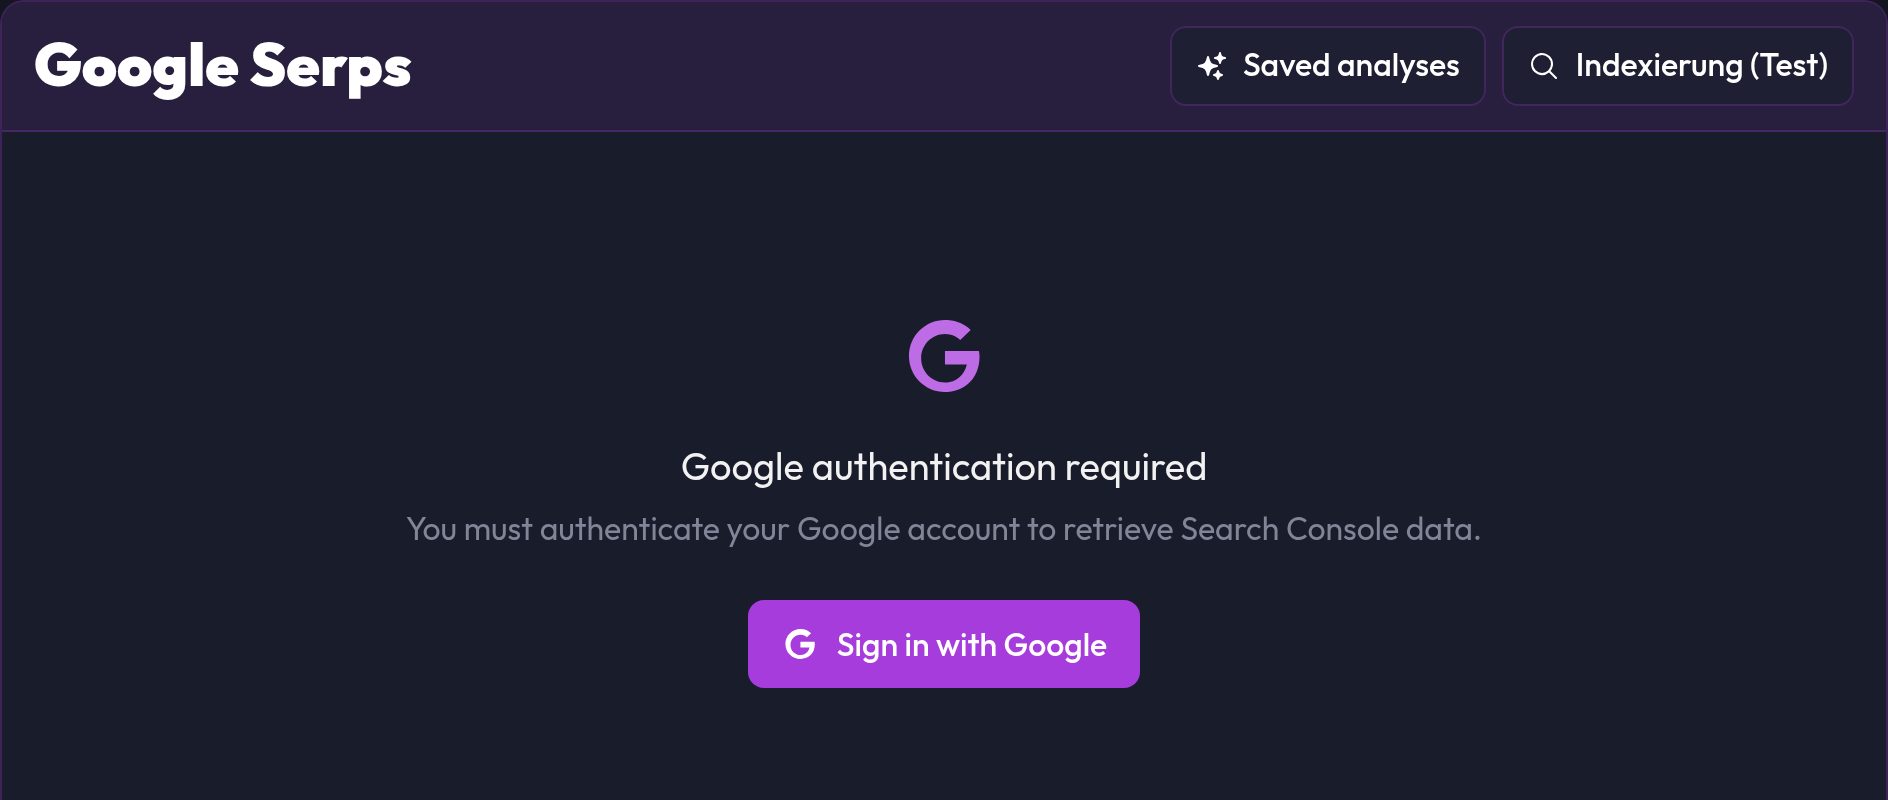
If one of the two is missing, the page tells you: "Sign in with Google" connects Google, "Create project" takes you to the account. If the connection has problems, "Sign in again" helps.
You find the page under SERPS in the navigation. It's only reachable when signed in.
Period and search type
At the top right you set the period (7, 30 or 90 days) and the search type: Web, Images, Video, Discover or News. The default view is normal web search.
The charts
At the very top is the trend with clicks, impressions and, if available, the position. Each series has its own axis, so what counts is mostly the direction of the line. Below are more cards:
- Position distribution: how many of your keywords sit on which results pages
- Top keywords performance: the ten keywords with the most clicks, compared to impressions
- Top performing pages: the ten pages with the most clicks
- Device traffic distribution and device performance comparison: desktop, mobile and tablet
- Country distribution: the ten countries with the most clicks
A gap between impressions and clicks shows you where your page is seen but not clicked. A better title or description is worth it there.
The tables
Below the charts you switch between four tabs: Keywords, Page Rankings, Device Performance and Countries. Every table shows position, impressions, clicks and CTR, and a click on a column header sorts it again.
The position is an average and can vary a lot by country and device. Lower is better: position 1 is at the very top, and page 2 starts at about 11.
Watching keywords
In the keyword table you can watch individual keywords with the icon at the start of the row. Watched keywords always stay on top, however you sort. "Watched only" hides the rest.
AI analysis for a page
In the Page Rankings tab every row has an "Analyze" button. It opens the AI optimization coach, which looks at page, keyword and metrics and makes concrete suggestions for improvement. It gets more precise if the page was captured in the crawler beforehand, because then it knows the content. Otherwise it points that out.
What to keep in mind
- Single days say little. Look at 30 or 90 days and at the direction.
- New pages need time. It often takes a few days until Google delivers data.
- Position alone isn't enough. A keyword at position 5 with lots of clicks brings more than one at position 1 that nobody searches for.
- High impressions with a low CTR usually point to a weak title or description.
For questions about the page itself, the Page Audit helps too.
Frequently asked questions
Why do I see no data?
Either Search Console isn't connected yet, or there is no data for the period. Also check whether the property matches your project domain.
Why do the numbers differ from other tools?
The values come straight from Google and are averages. Tools that query rankings themselves measure a single moment at one location.
Can I track competitors?
No, Search Console only provides data for your own pages.